selected works
/
Visualizing the EPA's watershed catchment boundaries
Overview
This is a web application that utilizes the EPA’s Streamcat API to visualize watershed catchment boundaries and export user-specified options related to each catchment area as a CSV file.
Challenge
The U.S. Environmental Protection Agency’s (EPA) StreamCat dataset provides over 600 landscape metrics for approximately 2.65 million stream segments across the United States. However, accessing and visualizing this extensive data was challenging for users without GIS expertise. The need was to create an intuitive web application that would allow users to easily visualize watershed catchment boundaries and export relevant data without requiring specialized software or knowledge.
Approach
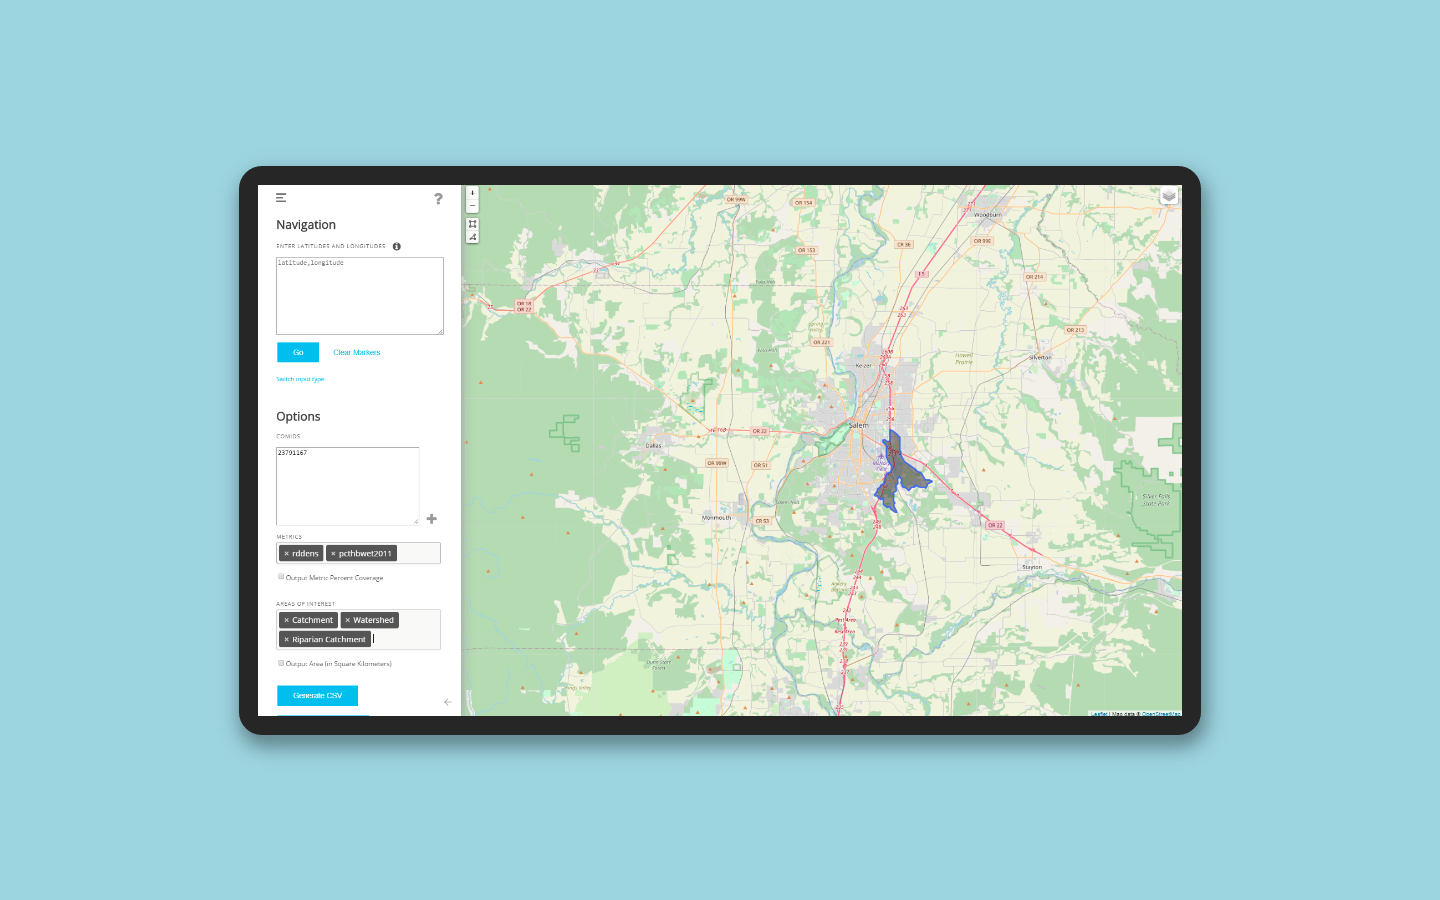
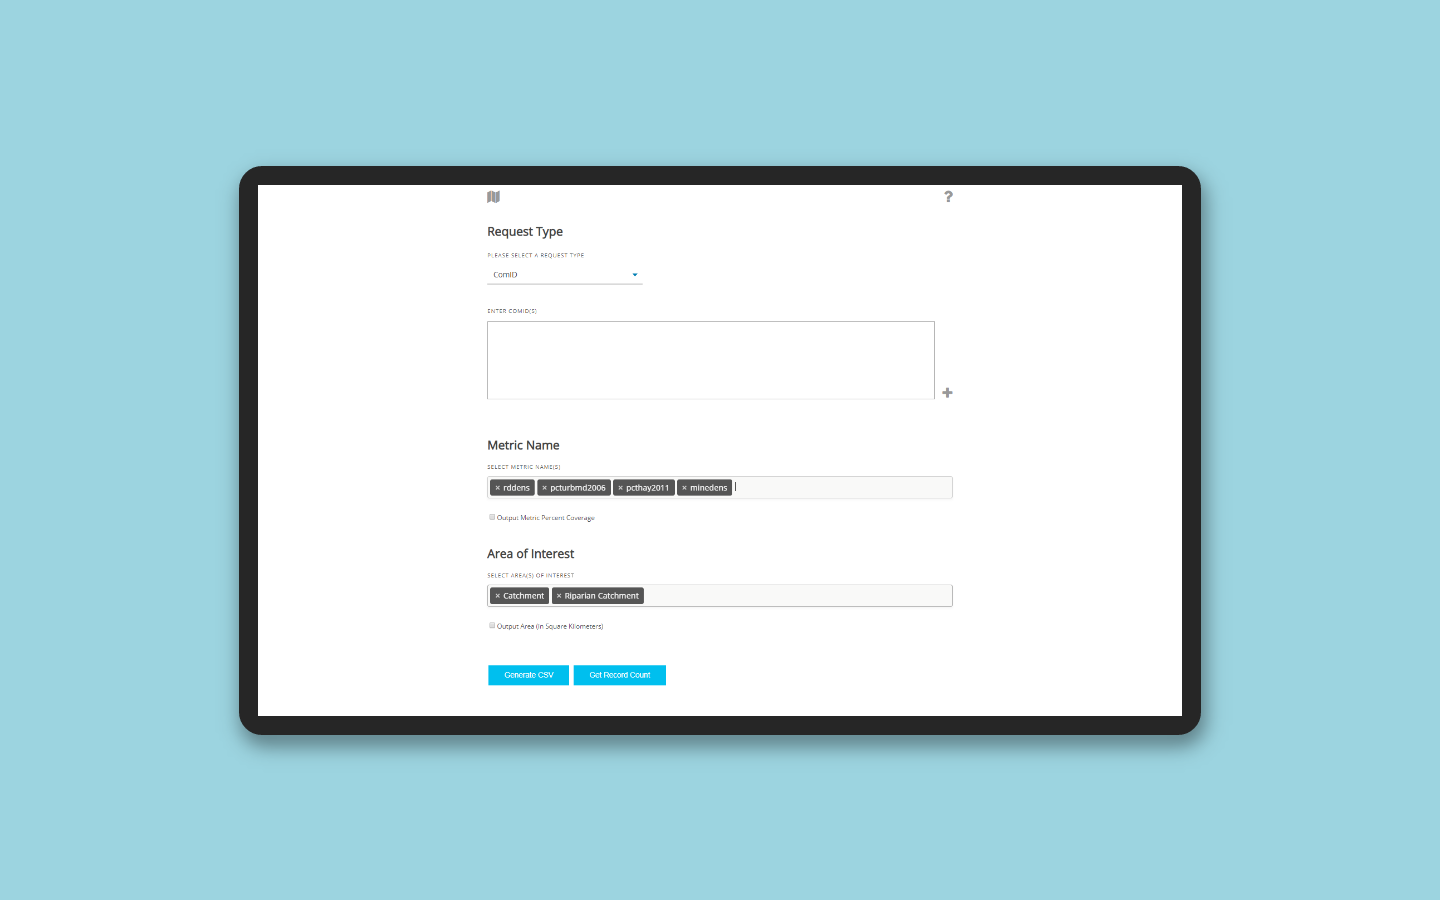
As the UI designer and front-end developer, I designed and developed a web application that interfaces with the EPA’s StreamCat API. The application features two primary views:
-
Map View: Allows users to interactively visualize individual catchment boundaries by clicking on the map or selecting areas using drawing tools.
-
Text View: Provides a tabular representation of the selected catchment’s data, enabling users to export the information as a CSV file for further analysis.
The application was built using modern web technologies such as Leaflet and jQueryUI to ensure responsiveness and ease of use, catering to both novice and experienced users.
Outcome
The StreamCat web application successfully simplified access to the EPA’s extensive watershed data, making it more accessible to a broader audience. Users can now easily visualize and export catchment data, facilitating informed decision-making in environmental research and management.
Client
Year
team
Role
- UI Design, Web App Development